

 |
 |
 |
![]() Introduction
Introduction
![]() Equipment
Equipment
![]() Measuring
in the field
Measuring
in the field
![]() Calculations
Calculations
The gradient of a river is a measure of how steeply it loses height. A river with a high gradient loses height quickly and is typically fast flowing and youthful. A river with a very gentle gradient loses very little height and is typically a slow flowing mature river. In fact, a lowland stream may have a gradient which is so gentle that it is impossible to measure without specialised equipment.
A graph to show how the gradient of a river changes along its length is called a long profile. For lengthy sections of rivers this can be constructed using the contours on a good map; for shorter sections, especially where the gradient is noticeable, it is possible to measure the gradient directly with very simple equipment.
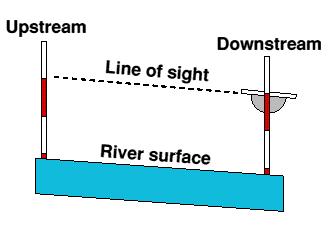
The most basic set of equipment
required is a clinometer and two surveying poles. Actually, any two poles can
be used so long as you can mark them both clearly the same distance from the
bottom. Something around 1.5m is usually a good height.
Some way of recording your data is also required, so plan how you will record
it before you start measuring anything.
Since you will be standing in the water to take your measurements you will also
need sensible clothing , foot wear, a towel and a warm drink.
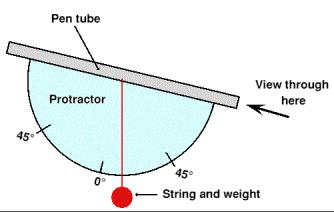
The most difficult part of the equipment to acquire is usually the clinometer. This is an instrument to measure angles. Clinometers can be bought, or easily constructed at home or school from a few readily available items.
Making a Clinometer
The following items are needed to
make a simple clinometer :
Method
1. Glue or tape one end of the string firmly to the center of the protractor
where all the lines meet. This will be half way along its flat base. Make sure
that the string can hang down freely when the protractor is held with the flat
side at the top.
2. Attach ( glue or tape ) the 'sight' tube along the straight edge of the protractor.
3. Attach your weight to the free end of the string and check again that the string can move freely as you tilt the protractor up and down.
That's all there is to it. You now have a clinometer which, hopefully, looks something like the one below.

Using your clinometer is quite simple.
You need to break up your river
into short lengths which you can easily measure.
Measure out a stretch of water where you want to begin your survey. The length
you choose is up to you but a couple of points should be remembered.
I find that anything from 5m to 15m is a good size stretch of river to survey per measurement, depending on the variation in the river itself and the degree of detail I want to record. There is nothing to stop you from choosing different distances every time you take a measurement, but this can make record keeping very difficult and confusing. Unless you have to alter your measuring length, keep it the same all the time.
Right, you've measured a length of river.

To produce your long profile you need a sheet of graph paper large enough to plot all your data at whatever scale you have chosen. The scale will have to be decided based on the size of paper you have and the length of your river survey.
For the moment, lets assume that one large square on your graph paper represents 1m along the river. If you took measurements over 10m lengths of the river, you will be entering data on your graph every 10 squares.
Start at the bottom left of your graph paper. This represents the lowest part of the river.
To show the gradient on your graph you can use one of two methods. Firstly you can use a protractor to draw lines at the correct angle from one measuring point to another. Thus if you had a gradient of 5 degrees you would draw a line going up at 5 degrees from the start of the measurement to its end.
This is the easiest method but it is hard to get the lines at exactly the right angle and you can soon get way off course, adding a little more error everytime you draw a new line.
The alternative way is to use the length of the measured section and the angle to find the change in height between the ends of the measured section.
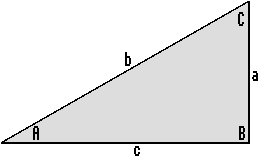
The triangle below represents our problem :

The letters on the triangle are :

A    The angle of gradient that you measured with the clinometer
B    A 90 degree angle
C    90 degrees - the angle of the gradient

a   The difference in height, which we want to find
b   The hypotenuse of the triangle
c   The distance between your two poles
To find the height (a) we use the Sine Rule, which goes like this :

By substituting the values we know
( A, B and c) we can find the height change represented by 'a'.
Once this value is known for each section we can plot the changes of height
on the long profile and join the points together. Although it's more work than
using the protractor the results are much better.
Once the profile has been drawn, remember to add a title, key, and both horizontal and vertical scales.
We value
your ideas and suggestions. Please contact the
maintainer of this site.
This page
can be found at: http://www.geography-site.co.uk
Last update to
this statement was on:
February 20, 2006
© Copyright Geography Site